Ottawa’s housing market in September demonstrated a continuation of late-summer seasonal trends, with sales activity easing slightly while inventory levels continued to climb. A total of 1,089 homes sold in September, down from 1,236 in August and 1,318 in July. This three-month trend of softer sales is not unusual as the spring peak transitions into the quieter summer months.
On the price side, the average sale price of $690,397 in September fell between August's $686,536 and July's $695,209, remaining up 0.3% year-over-year. Benchmark prices have remained relatively stable throughout this adjustment period, indicating that demand is holding steady even as buyers gain more choice.
Active listings rose to 4,388 in September, following 3,971 in August and 4,205 in July. These elevated inventory levels are a departure from undersupplied pandemic-era levels and align more with longer-/unbalanced conditions, though at elevated levels, which continues to be a trend worth monitoring. Continued steady demand helps to explain why prices have stayed relatively flat even as inventory builds. Months of inventory edged up to 4.0, compared to 3.2 in August and 3.2 in July, reinforcing this balance between buyers and sellers.
On September 17, the Bank of Canada cut its key policy interest rate by 25 basis points to 2.5%, citing slowing global growth and easing inflation pressures. This policy shift, combined with Ottawa’s resilient demand and balanced market conditions, could encourage more first-time buyers and bring additional activity to the market in the months ahead.
“September reinforced Ottawa’s resilience, with sales nearly 2.4% higher than last year, and prices are holding steady despite more listings coming to market,” said OREB's President. “When you peel back the layers, you see that townhomes are driving stability while single-family homes are easing. And while Ottawa’s diversity of housing continues to increase inventory, missing middle housing—like townhomes—still aren't being built fast enough, and that's something OREB continues to advocate for.”
Residential Market Activity:
Looking at the bigger picture, there have been 11,025 home sales so far this year, which is 3.9% higher than at this time in 2024. The average sale price for all sold listings in September was $690,397 up 0.3 % from last year. This year, the average year-to-date price is $699,910, a 2.7% increase over the first nine months of 2024. Altogether, the total value of homes sold in September was approximately $751 million, up 2.8% year-over-year, with the housing sector continuing to be one of the major drivers of the overall ottawa economy.
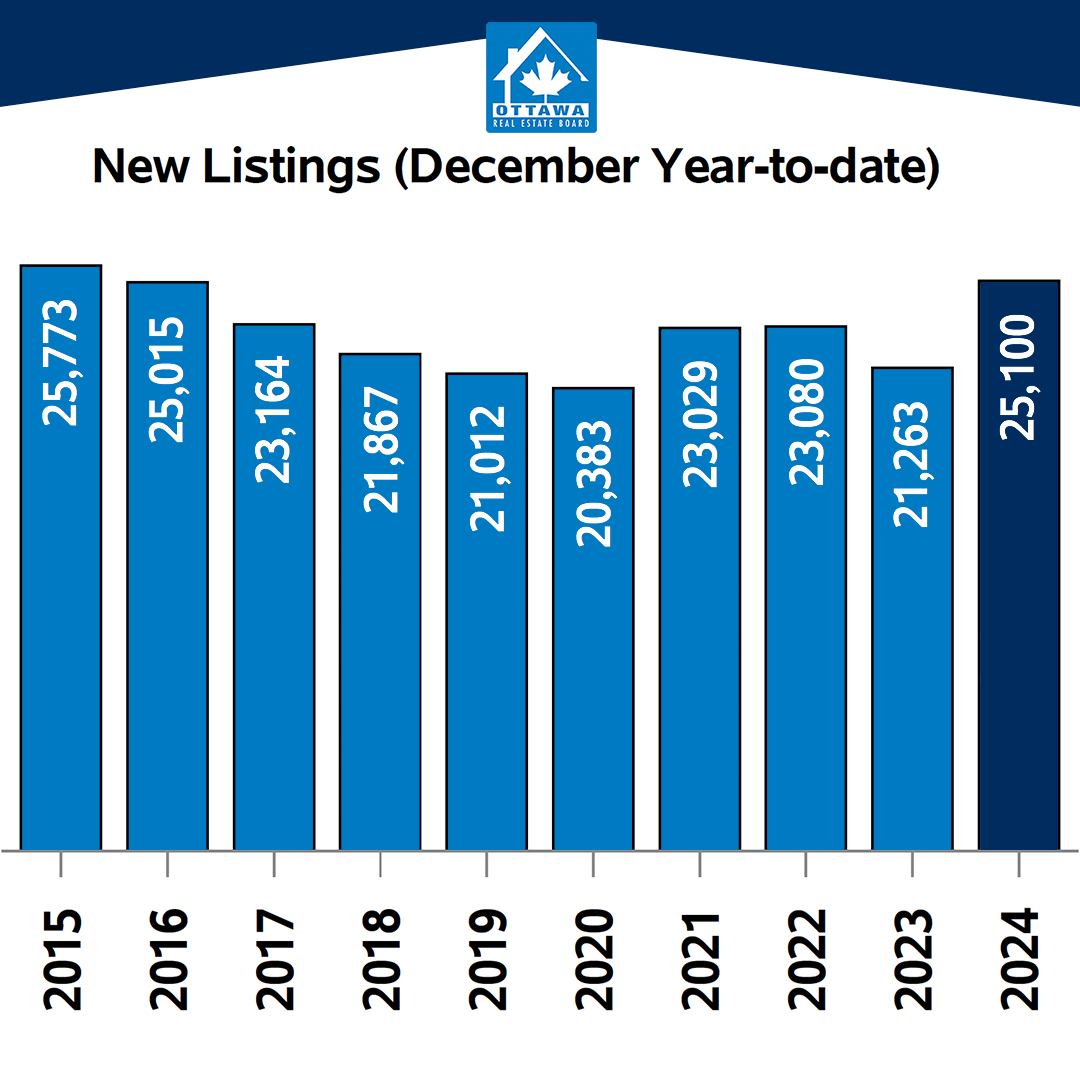
On the listing side, there were 2,832 new residential listings added in September, a notable 19.3% increase compared to last year, and 4,388 active listings on the market, up 19.4% from September 2024, and roughIy 21.8% above the five-year average for this time of year.
Finally, the months of inventory, a measure of supply, sits at 4.0 months, which is up from 3.2 months of inventory in August. Having 4.0 months of inventory is typically understood to be an indicator of what is considered a balanced market.
MLS Home Price Index:
As for prices, the MLSO Home Price Index (HPI) composite benchmark price in Ottawa was $627,200 in September, a nearly flat 1.1% increase year-over-year. If we break that benchmark price down by property type:
• Single-family homes came in at $697,200, up 1.0%
• Townhouses saw the biggest jump — up 7.8% to $462,800.
• Apartments, on the other hand, dipped again, — down 1.7% to $408,200.
Canada’s housing market is ripe with possibility, but the new buyer hopefuls are taking their time
Despite Improving Affordability, Majority of First•Time Homebuyers Say They Plan to Buy in 12-24 Months. Canada's housing market may be opening new doors for first-time buyers, thanks to lower borrowing rates, softer prices and more listings to choose from. But uncertainty in the economy and an abundance of choice have led to a lack of urgency to buy, prompting many young Canadians to take their time before entering the market.
According to a recent Royal LePage survey, conducted by Burson*, 13% of Canadian adults say they are actively working towards the purchase of their first residential property within the next two years. Of this group, a small proportion say they are working towards their first purchase within the next 12 months, while the majority (82%) say they are planning to make a purchase in 12 to 24 months.
When asked what stage of the purchasing process they are in, more than half (51%) of first-time buyers said they are currently researching neighborhoods where they can afford to live, 49% are actively browsing online listings, 19% are actively viewing homes listed for sale in person, and 19% have engaged with a real estate agent. Respondents were able to select more than one answer.
“Interest rates are trending lower, and prices have stabilized or even softened in some markets, creating favorable conditions for long- awaited entry into home ownership, especially in costly cities like Toronto and Vancouver. Yet, hesitation remains,” said Phil Soper, president and CEO, Royal LePage. “For some, ongoing economic uncertainty, particularly surrounding trade relations with the United States, is prompting them to hold off until there are signs of stability. Buying a home is the biggest financial decision most people will ever make, and first-time buyers naturally want to do so with as much certainty as possible.
“Others are choosing to wait in hopes of securing a better deal. With the potential for further rate cuts from the Bank of Canada this year, those in no rush to purchase now are taking a methodical approach — building up their savings and deliberately planning their entry into the market when they feel the timing is best for them.”
Other Interesting Highlights from the Survey:
More than half (53%) of first-time buyers plan to put at least 20% down on their purchase; while 39% will not and will therefore need to buy mortgage insurance.
42% of first-time buyers say they will prioritize the neighborhood where they want to live, regardless of the distance to their job, while 31% say they will purchase a home based on proximity to their work.
Financial Support Continues to Flow from Family to First-Time Buyers
While many buyers continue to rely on help from family to make their first home purchase, most do not. When asked if they would receive any financial assistance towards the purchase of their first residential property, more than half (51%) said they would not receive any help. Meanwhile, 41% of first-time buyers said they would. Even as affordability has improved in several markets over the past year, many first-time purchasers continue to rely on financial support to take their first step on to the property ladder.
“Despite improving affordability, many first-time buyers continue to rely on family financial support. This transfer of wealth has become increasingly common, as parents look to give their children the same opportunity for stability and long-term financial growth that they themselves experienced through home ownership. For some buyers, financial contributions from family can make the decisive difference between becoming a homeowner and remaining a tenant,” said Soper.
“However, many lack access to this kind of support, forcing them to adopt more creative and often difficult approaches to saving. Some delay major life milestones, such as marriage or starting a family, to prioritize home ownership. Others cut back significantly on discretionary spending or continue living at home with parents well into adulthood to build up their savings. While determination and careful planning help these buyers reach their goals, the gap between those who receive financial assistance and those who do not highlights the deep affordability challenges in today's market.”
Finding a home that is move-in ready is the most important non-price related factor for first-time buyers, according to Royal LePage professionals across the country.
*Burson used the Leger Opinion online panel to survey 2,500 adult residents across Canada. The survey was completed between August 4 and August 9, 2025. Age, gender, and regional weighting was applied to ensure representation ata national level according to 202f census figures.


 The trademarks REALTOR®, REALTORS®, and the REALTOR® logo are controlled by The Canadian Real Estate Association (CREA) and identify real estate professionals who are member’s of CREA. The trademarks MLS®, Multiple Listing Service® and the associated logos are owned by CREA and identify the quality of services provided by real estate professionals who are members of CREA. Used under license.