
The number of homes sold through the MLS® System of the Ottawa Real Estate Board (OREB) totaled 809 units in February 2025. This represented a 10.2% decline from February 2024.
Home sales were 19.1% below the five-year average and 15.4% below the 10-year average for the month of February.
“Ottawa’s sales activity moderated while prices held steady,” says OREB President Paul Czan. “Despite increased inventory, market uncertainty continues to influence buyer and seller decisions. Some sellers who had previously delayed listing are now entering the market, contributing to more options for buyers. While demand remains strong in certain price segments, the pace of sales varies, making strategic pricing and preparation key for sellers.”
“The Bank of Canada’s influence on borrowing power, ongoing economic factors like tariffs, and the potential impact of upcoming elections are also shaping buyer and seller sentiment,” adds Czan. “As we approach the spring market, we anticipate increased buyer activity, particularly if interest rates trend downward and confidence continues to build.”
By the Numbers – Prices:
The average price of homes sold in February 2025 was $669,945, a 1.4% improvement from February 2024.
The total dollar volume of all home sales in February 2025 amounted to $541.9 million, an 8.9% drop compared to the same period last year.
OREB cautions that the average sale price can be useful in establishing trends over time but should not be used as an indicator that specific properties have increased or decreased in value. The calculation of the average sale price is based on the total dollar volume of all properties sold. Prices will vary from neighbourhood to neighbourhood.
By the Numbers – Inventory & New Listings:
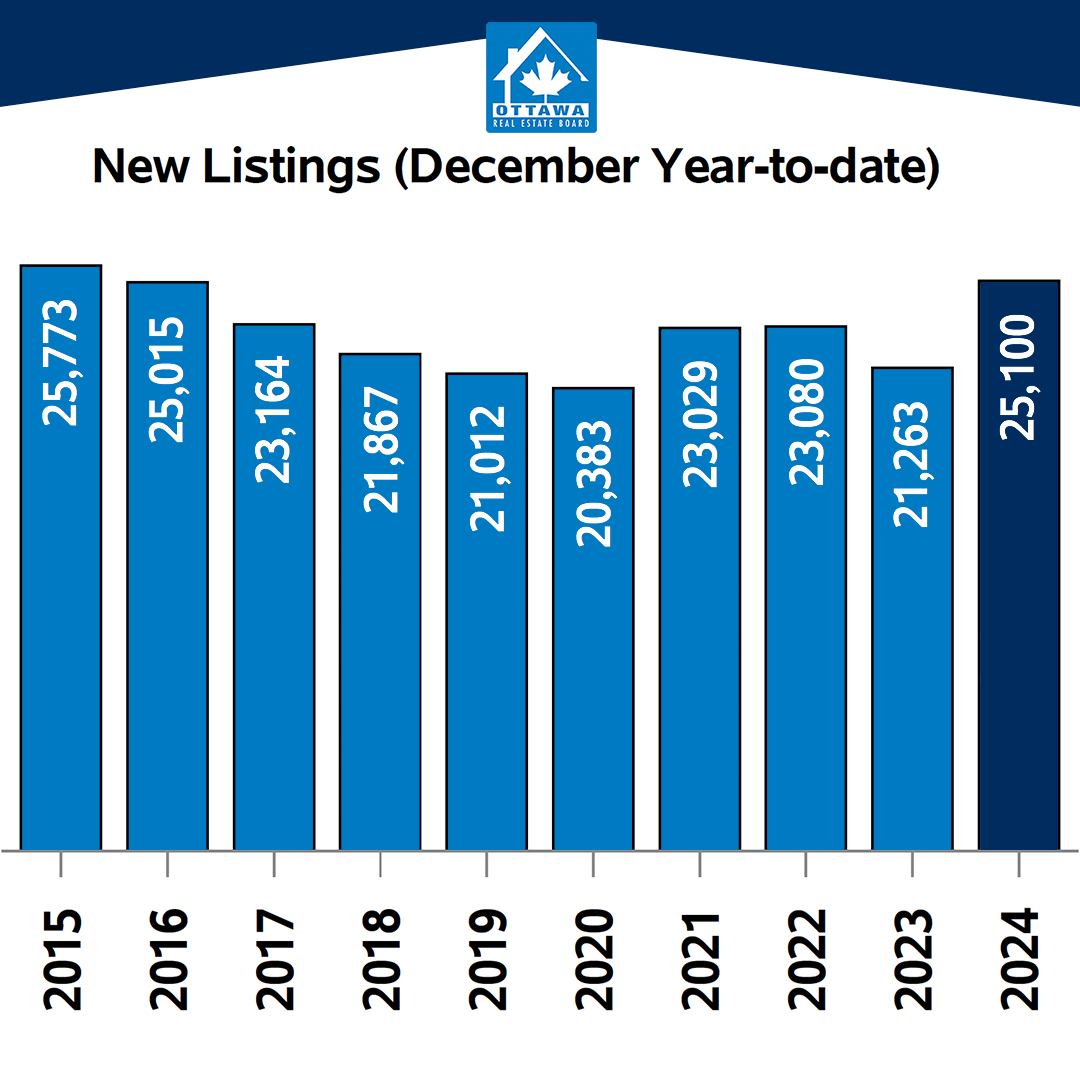
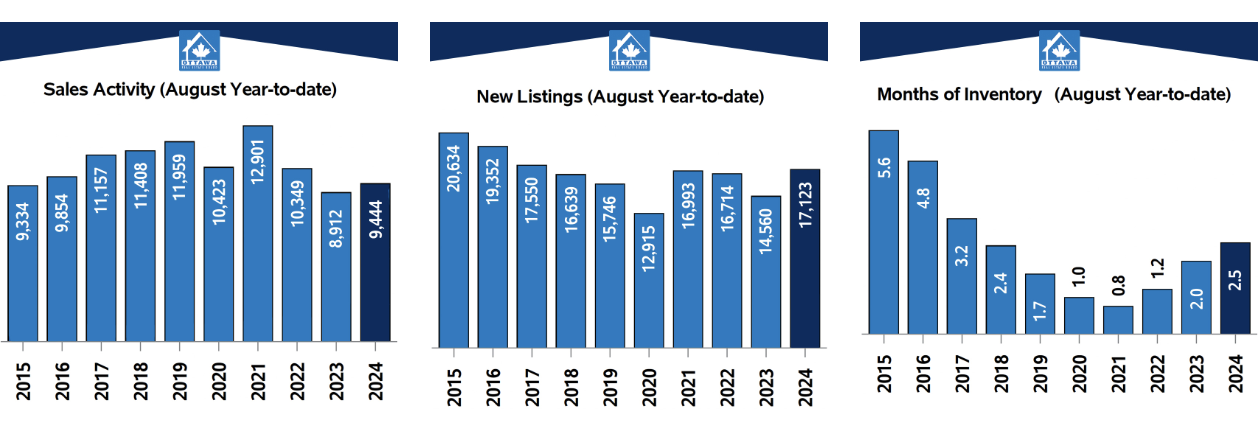
The number of new listings rose by 4.8% compared to February 2024, with 1,668 new residential properties added to the market. New listings were 10.8% above the five-year average and 6.7% above the 10-year average for the month of February.
Active residential listings totaled 3,735 units at the end of February 2025, reflecting a substantial 61.4% surge from February 2024. Active listings were 95.7% above the five-year average and 51.4% above the 10-year average for the month of February.
Months of inventory stood at 4.6 at the end of February 2025, compared to 2.6 in February 2024. The number of months of inventory is the number of months it would take to sell current inventories at the current rate of sales activity.


 The trademarks REALTOR®, REALTORS®, and the REALTOR® logo are controlled by The Canadian Real Estate Association (CREA) and identify real estate professionals who are member’s of CREA. The trademarks MLS®, Multiple Listing Service® and the associated logos are owned by CREA and identify the quality of services provided by real estate professionals who are members of CREA. Used under license.